The article bellow is the written version of the following video tutorial, so if you prefer to watch the video “just click it” :).
Preparation
As a test project for debugging we use the following PHP MVC Framework therefore If you want to follow along, please download (or clone) the project into your xampp_installation_folder/htdocs folder and follow readme to set it up without docker.
Enable Xdebug with XAMPP installation
Make sure you have XAMPP installed properly and you have added PHP executable path into system variables path.
1. Create php file (Ex: info.php) in xampp/htdocs folder and print php information.
<?php
echo phpinfo();
2. Access the info.php file in browser: http://localhost/info.php, and copy the output.
3. Open https://xdebug.org/wizard and paste php info output in the textarea and click Analyse my phpinfo() output button. It will suggest you the *.dll file to download.
4. Download the *.dll file and put it in xampp_installation_folder/php/ext folder (For simplicity rename the downloaded *.dll file into php_xdebug.dll).
5. After this, open php.ini file and add the following code at he very bottom.
[XDebug]
xdebug.mode=debug
xdebug.start_with_request=yes
zend_extension = "xampp_installation_folder\php\ext\php_xdebug.dll"
6. Finally, restart apache web server.
Configure VS Code for debugging
Now since we have enabled xdebug and restarted apache, its time to configure our editor to be able to debug PHP applications.
7. Open your project in VS code.
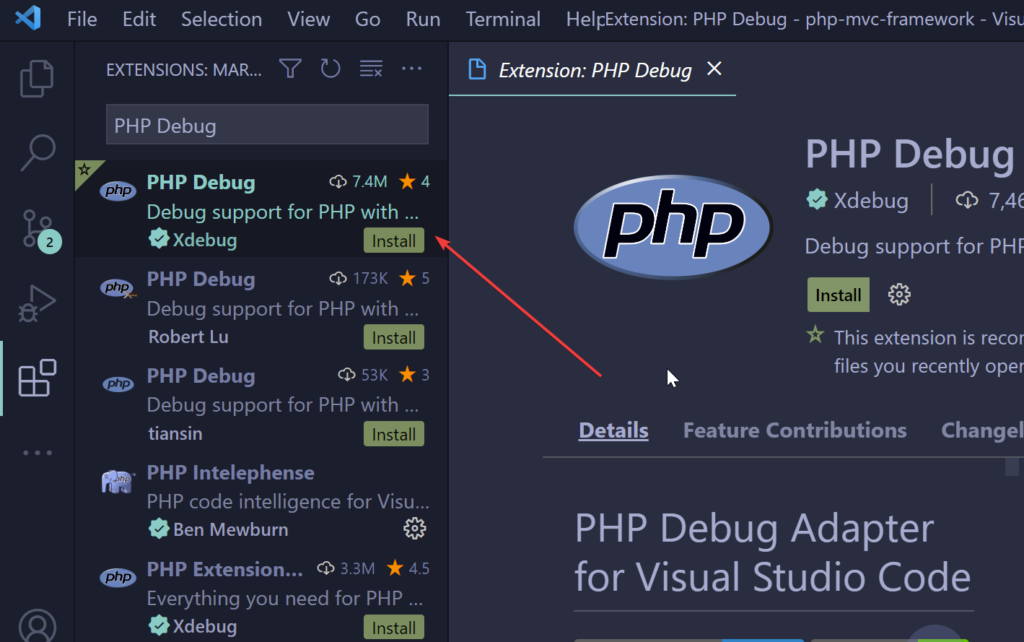
8. Install PHP Debug VS code extension.

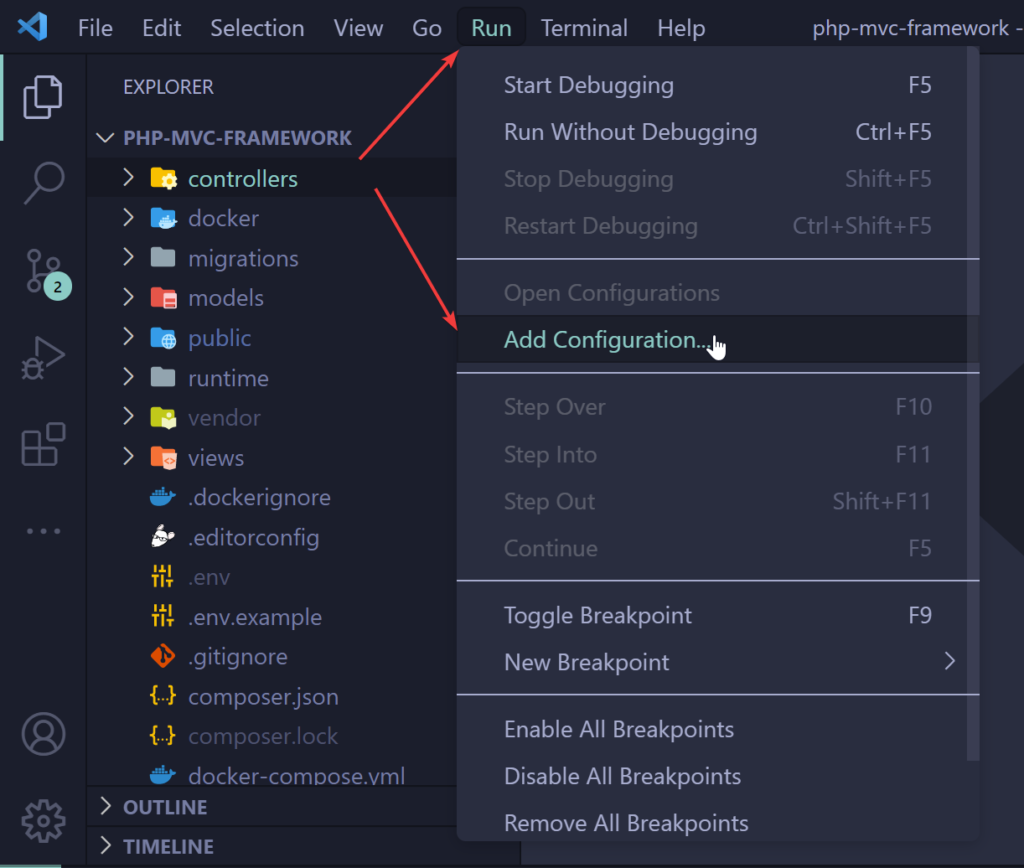
9. Add configuration by clicking Run -> Add Configuration and choose PHP. Please be aware that if you skip the last step PHP option will not be available in Add configuration options. In other words, PHP only appears in configuration after you install PHP Debug extension.

As a result of the previous step you should see .vscode folder created in project’s root directory and launch.json inside. If you see that, you are good to know. If you don’t see the .vscode folder, call to 911 or leave a comment down bellow.
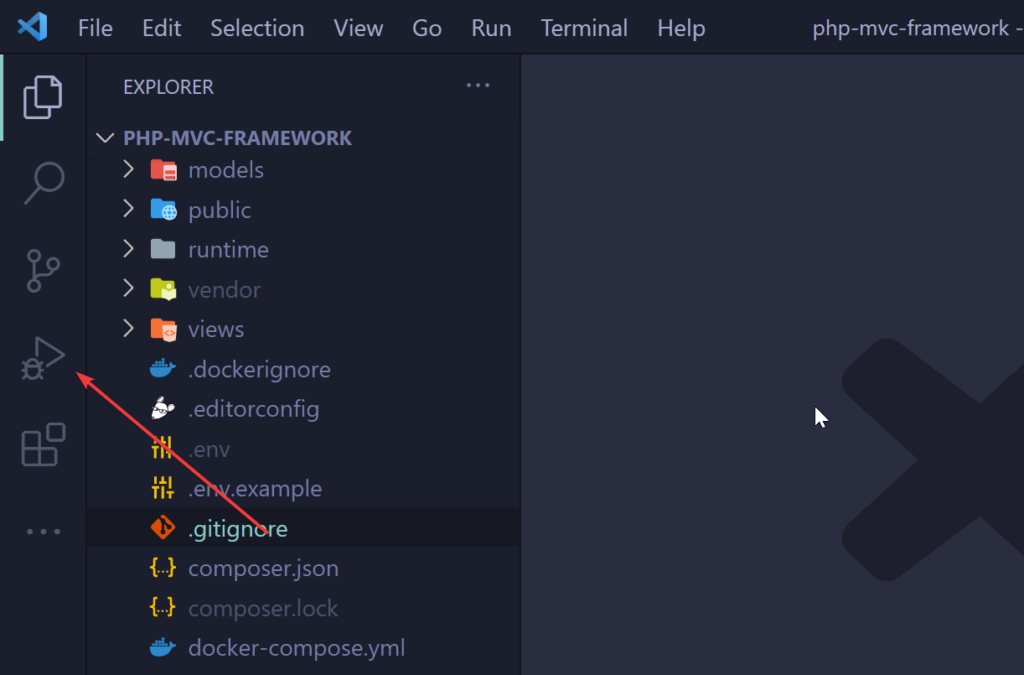
10. Click on “Run and Debug” tab in VS Code.

Debugging with Apache
Now let’s have some fun. We have enabled Xdebug in apache, installed PHP Debug and added PHP configuration, which on its own created .vscode/launch.json file. Are you ready to have some fun?

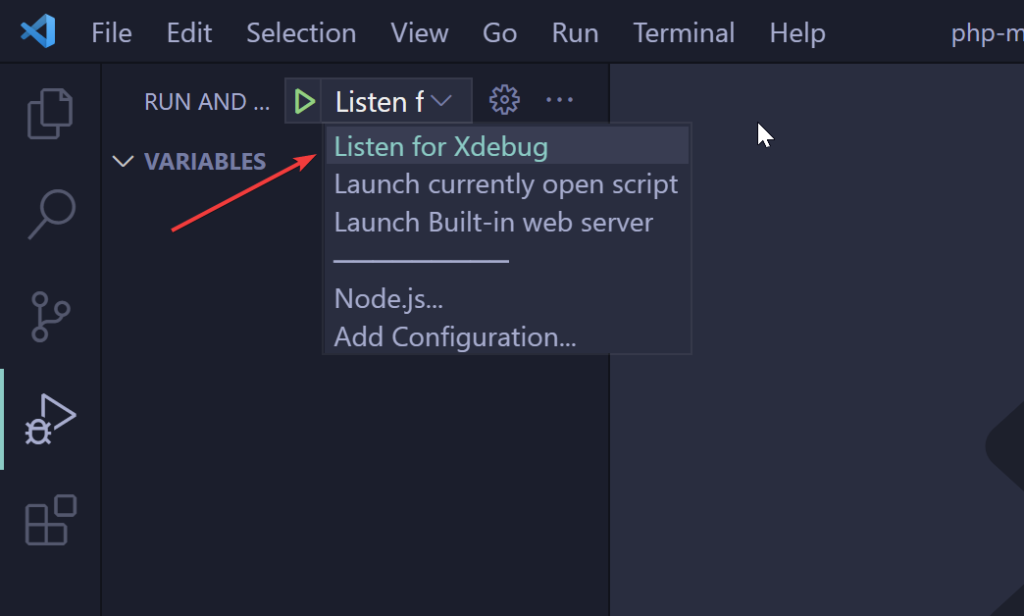
11. Choose Listen for Xdebug from dropdown options and click green play button.

12. Open your project and create breakpoints.
Now you can open your project in browser and debugging should start.

Debugging with PHP built-in server
Open the file .vscode/launch.json from the project, after this the object which has name: Launch Built-in web server and modify few things.
Here is how launch.json looks like.
{
    // Use IntelliSense to learn about possible attributes.
    // Hover to view descriptions of existing attributes.
    // For more information, visit: https://go.microsoft.com/fwlink/?linkid=830387
    "version": "0.2.0",
    "configurations": [
        ...
        {
            "name": "Launch Built-in web server",
            "type": "php",
            "request": "launch",
            "runtimeArgs": [
                "-dxdebug.mode=debug",
                "-dxdebug.start_with_request=yes",
                "-S",
                "localhost:0"
            ],
            "program": "",
            "cwd": "${workspaceRoot}",
            "port": 9003,
            "serverReadyAction": {
                "pattern": "Development Server \\(http://localhost:([0-9]+)\\) started",
                "uriFormat": "http://localhost:%s",
                "action": "openExternally"
            }
        }
    ]
}
Change runtimeArgs into this.
"runtimeArgs": [
    "-S",
    "localhost:8000",
    "-t",
    "."
],
Remove "program" and change "cwd" into "${workspaceRoot}/public", also remove "pattern" and "uriFormat" from "serverReadyActions".
So, here is how final version of “Launch built-in web server” should look like.
{
    // Use IntelliSense to learn about possible attributes.
    // Hover to view descriptions of existing attributes.
    // For more information, visit: https://go.microsoft.com/fwlink/?linkid=830387
    "version": "0.2.0",
    "configurations": [
        ...
        {
            "name": "Launch Built-in web server",
            "type": "php",
            "request": "launch",
            "runtimeArgs": [
                "-S",
                "localhost:8000",
                "-t",
                "."
            ],
            "cwd": "${workspaceRoot}/public",
            "port": 9003,
            "serverReadyAction": {
                "action": "openExternally"
            }
        }
    ]
}
At 11th step choose a different option: Launch built-in web server and click play button.
This should start built-in web server, now open http://localhost:8000 in browser. If you have breakpoints in your project the debugging should start.
Make sure you have MySQL server running, otherwise you will have a connection error.
Was it helpful? Why don’t you share it and help others and help me as well?!

Мы предлагаем сделать «ссылочный прогон» для вашего сайта. О нас: Мы являемся компанией, более 10-ти лет предоставляющей услуги «ссылочного прогона» (массового размещения ссылок на сторонних сайтах) и хотели бы предложить вам данную услугу. В результате, через 3-5 дней, DR (Domain Rating) рейтинг вашего домена повысится, что положительно отразится на выдаче вашего сайта в Гугле и Яндексе. Если размещать ссылки на регулярной основе, то через 1-3 месяца, также, повысится и Яндекс показатель ИКС сайта. На сегодняшний день, это самый быстрый и недорогой вариант повышения авторитета сайта и улучшения его позиций в выдаче. Стоимость прогона составляет от 2 000 руб. и выше (и зависит от объёма размещаемых ссылок). Подробности см. на нашем сайте https://gototop.ee/ или пишите мне на alexey@gototop.ee Спасибо
I’m no longer sure the place you are getting your
info, however great topic. I needs to spend a while studying more or working out more.
Thank you for fantastic information I used to be searching for this information for my mission.